The dream of a comfortable family life – complete with a secure home 🏡, dependable transportation 🚗, quality childcare 🧒, and the peace of mind that comes with savings 💰 – has long been a cornerstone of aspirations. Yet, for countless households in the modern era, achieving this balance feels like an uphill battle. The crux of the matter isn’t just about the sheer amount of money earned, but critically, how much income actually remains after life’s essential bills are settled. 🤔
Picture a family striving to build a secure future. Their needs are fundamental: shelter, nourishment, a way to get to work, and reliable care for their children. Beyond these necessities, they yearn for a financial cushion for unexpected events and a little breathing room between paychecks. Now, contrast this modern scenario with the financial realities faced by families just a few decades ago. The landscapes of work, expenditure, and expectations have undoubtedly shifted. A comparison between the world of 1980 and the projections for 2026 prompts a poignant question: has the act of earning a living become inherently more demanding than the act of living comfortably on that income? 🧐
An insightful infographic has brought this concern to the forefront, dissecting the disparities across five key areas: the workforce, housing availability, the cost of housing, automotive ownership, and childcare. While the comparison is stark and perhaps provocative, the underlying query it poses is worthy of careful consideration, especially for anyone navigating the complexities of a household budget today. 📊
The Core Insight: More Income Doesn’t Always Mean More Affordability
The fundamental takeaway is that a higher household income doesn’t automatically translate into a more affordable lifestyle. The rising tide of earnings doesn’t always lift all boats if the costs of essential goods and services outpace income growth significantly. 📉
The Evolving Household: One Income Versus Two
The infographic paints a vivid picture: in 1980, it suggests a single income was often sufficient to support a family and maintain a comfortable standard of living. Fast forward to 2026, and the narrative shifts to households where two incomes are frequently necessary simply to cover fundamental expenses. This contrast strikes a chord with many contemporary families grappling with the reality that even with two earners, disposable income can remain elusive when housing, transportation, childcare, and other necessities consume a disproportionate slice of the earnings pie. 👩💻👨💻
However, it’s crucial to acknowledge the diversity in household structures. While two incomes can undeniably offer greater financial flexibility and opportunities for saving, a single-income household faces its own unique set of costs and responsibilities. The sheer number of income earners doesn’t solely determine a family’s financial well-being. Other factors, like efficient budgeting and strategic spending, play equally vital roles. 👍
Then vs. Now: A Glimpse into Household Economics
- The Earlier Era (circa 1980): A single primary income was often portrayed as capable of sustaining a family’s expected lifestyle, covering essentials and allowing for some discretionary spending and savings. 👨👩👧👦
- The Modern Challenge (circa 2026): Families increasingly rely on dual incomes, yet they may still find themselves stretched thin, struggling to manage the escalating costs of daily life and facing pressures to maintain their financial footing. 💸
The Housing Hurdle: From Spacious Homes to Smaller Spaces
Housing stands as a central pillar in this affordability argument. The infographic contrasts the relative ease of securing a three-bedroom family home in 1980 with the formidable challenge of finding even a two-bedroom dwelling in 2026. This disparity stems from the widening gap between home prices and available income. A home can become increasingly out of reach, even when household earnings have risen, if property values escalate at a pace that outstrips a family’s capacity to save for a deposit or manage mortgage repayments. 🏠⬆️
Homeownership Aspirations: A Shifting Landscape
- 1980’s Vision: The infographic depicts a more accessible family home, often characterized by a comfortable three bedrooms, suggesting a greater likelihood of achieving homeownership dreams. ✨
- 2026’s Reality: The modern portrayal highlights a more constrained housing market, where securing even a two-bedroom property may represent a significant financial feat, reflecting increased market competition and higher price points. 😥
It’s vital to remember that these descriptions serve as illustrative examples rather than absolute truths. Housing prices and affordability are dynamic and vary significantly based on geographic location, individual household income levels, property types, and prevailing financing conditions. Nevertheless, this comparison underscores why housing deserves a prime position in any comprehensive, long-term financial strategy. 🗺️
The Price-to-Income Ratio: Understanding Housing Costs
The infographic posits a dramatic shift in housing costs relative to annual income. It suggests that in 1980, housing expenses hovered around three to four times a family’s annual income, whereas by 2026, this figure could balloon to eight to ten times annual income. If these ratios hold true for a specific housing market, they signal a profound affordability crisis. A higher price-to-income ratio implies that a household needs significantly more years of income to afford a property, even before factoring in taxes, daily living expenses, interest on loans, and other associated costs. 📈
Important Context: Ratios and Realities
The ratios mentioned are figures presented within the infographic’s comparative framework. They should not be treated as universally applicable statistics without specifying the geographical location, the data sources used, and the precise methodology of comparison. Economic conditions and housing markets are diverse globally. 🌍
For practical personal financial planning, the more immediate question becomes: what proportion of your monthly income can you realistically allocate to housing while still adequately covering essential living costs, building an emergency fund, and setting aside funds for future needs? This personal budget assessment is paramount. 💰✅
Transportation Trends: One Car to Two, Financed Journeys
Another stark contrast highlighted by the infographic involves transportation. It contrasts the scenario of owning one car outright in the past with the contemporary reliance on financing for two vehicles. A vehicle payment represents a substantial recurring financial obligation. When a household commits to financing multiple cars, its budget must accommodate not only the loan repayments but also ongoing expenses such as fuel, insurance, maintenance, and other related costs. ⛽️🔧
Financing a vehicle isn’t inherently a negative financial decision, just as owning a car outright doesn’t mean transportation is free. The key differentiator is whether the total cost associated with the chosen transportation solution aligns with the household’s overall financial capacity and genuine needs. A vehicle should be an enabler of your financial life, not a silent drain on the resources needed to build it. Always aim to review the full cost of transportation, rather than focusing solely on the monthly instalment. 🚗💡
Childcare and Family Expenses: The Growing Burden of Care
The infographic touches upon childcare, contrasting an era where it might have been perceived as free (perhaps due to stay-at-home parenting or reliance on extended family and community support) with the reality of expensive professional childcare services in 2026. Modern childcare arrangements can impose a significant financial burden on working parents. Simultaneously, unpaid caregiving also carries its own economic implications, including the potential for one parent to reduce paid working hours or even exit the workforce entirely. 👩👧👦➡️🏠
Therefore, a truly equitable comparison must account for both direct financial outlays for childcare and the less tangible, yet significant, costs associated with time, career progression, and employment choices tied to child-rearing. Family experiences are diverse, and no single model of childcare or family structure is universally applicable. Understanding these nuances is key to accurate financial assessment. 🧐
The Broader Economic Narrative: Income vs. Outlay
The infographic distills its core message into a powerful statement: “One income bought a life. Now two barely buy survival.” This encapsulates the growing concern that even with increased total household earnings, families may feel financially strained when the cost of essential goods and services consumes a disproportionately large portion of their income. The assertion that “That’s not inflation. That’s a different game” suggests a systemic shift in affordability rather than solely attributing the issue to rising price levels. While inflation is undeniably a factor, the argument points towards broader structural changes in the economy that impact how far earnings stretch. Rising prices, stagnant income growth in certain sectors, evolving housing markets, conscious household choices, and access to support systems all play a role in shaping the modern financial landscape. 🌍➡️💰
From Awareness to Action: Safeguarding Your Household Finances
While you cannot control every fluctuation in the global economy, and budgeting alone cannot solve a housing affordability crisis, a profound understanding of your personal finances empowers you to make more informed and strategic decisions about the money you control. Knowledge is power when it comes to managing your household budget. 💪
Five Pillars of Household Financial Protection:
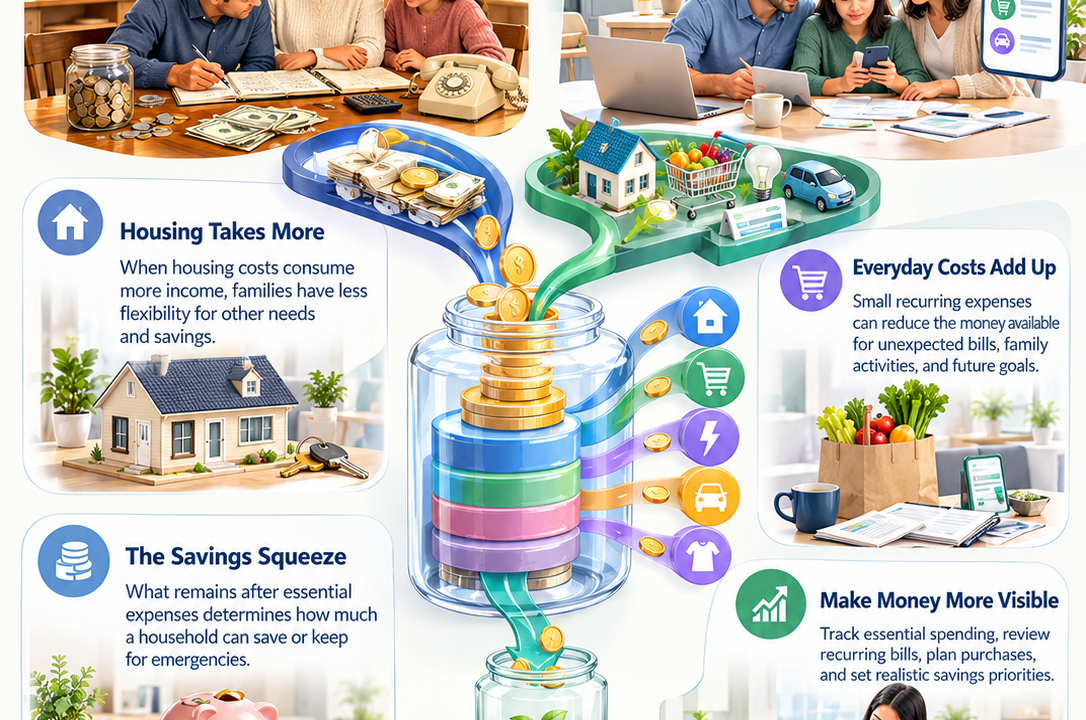
- Know Your Financial Flow: Meticulously track your net income, all household bills, food expenses, transportation costs, childcare fees, and debt repayments. A crystal-clear view of your spending patterns is the first step to identifying where your money is allocated each month. 📝
- Prioritize the Essentials: Differentiate between essential expenditures and discretionary spending. Focus your financial attention first on fundamental needs like housing, food, utilities, necessary transportation, and other obligations that keep your household functioning smoothly. 🏠🍎⚡️
- Cultivate an Emergency Reserve: Aim to set aside an amount that aligns with your personal circumstances, even if you need to start with small, consistent contributions. A well-maintained emergency fund can be your lifeline during unexpected expenses, preventing the immediate need for high-interest borrowing. 🛡️
- Look Beyond the Monthly Payment: Before committing to significant purchases like a home, a car, or other major expenses, thoroughly evaluate the total cost of ownership, anticipate ongoing bills, and assess how such a commitment might impact your ability to save and achieve other financial goals. 🧐
- Give Your Savings a Purpose: Define clear objectives for your savings. Whether it’s building an emergency reserve, accumulating a down payment for a home, funding education, or preparing for future family needs, having well-defined goals can guide your saving strategy and help you make deliberate choices about where to cut back on spending. 🎯
The Heart of the Matter: Key Takeaways for Financial Resilience
- The infographic effectively highlights widespread concerns about the relationship between household income and the cost of essential life needs.
- Housing affordability is intrinsically linked to the ratio of property prices to income, not merely to an increase in earnings.
- Significant financial commitments like transportation and childcare can drastically influence the amount of income available for other financial priorities.
- Comparisons between historical periods (like 1980) and future projections (like 2026) require localized context and reliable data to be generalized accurately.
- A realistic budget, a robust emergency fund, and prudent borrowing decisions are crucial building blocks for enhanced financial resilience.
A Final Perspective: Financial Security Transcends the Paycheck
The comparison between 1980 and 2026 poses a fundamental question for anyone managing a household: after covering life’s necessities, is there sufficient financial capacity remaining to prepare adequately for the future? 🔮
The answer to this question will inevitably vary across different countries, generations, and individual families. While the infographic raises valid concerns about affordability, its broad comparisons should be viewed as a catalyst for discussion rather than a definitive economic history. For us at SmartSave.top, the actionable lesson is clear: understand the unique financial pressures affecting your household, make deliberate and informed financial choices, and diligently build your savings around your specific needs and priorities. You may not have control over the price of everything, but you absolutely have the power to make your financial decisions more astute and strategic. 🧠✨
Your income powers today. Your savings are your investment in tomorrow. 🚀